How to setup OpenTelemetry instrumentation in ASP.NET core
October 14, 2024 by Anuraj
dotnet AspNetCore OpenTelemetry
In this blog post, we’ll learn how to setup OpenTelemetry instrumentation in ASP.NET core. OpenTelemetry is an open-source observability framework that provides a set of tools, APIs, and SDKs for generating, collecting, and exporting telemetry data such as traces, metrics, and logs. It is designed to be vendor-agnostic, allowing developers to instrument their applications and systems without being tied to a specific backend. This helps in understanding the performance and health of cloud-native applications and distributed systems by standardizing the way telemetry data is collected and transmitted.
First we will be creating an ASP.NET MVC Web Application. We can do this using the command dotnet new mvc --name web-example. Next we need to configure the various OpenTelemetry nuget packages, we can do this with following commands.
dotnet add package OpenTelemetry.Extensions.Hosting
dotnet add package OpenTelemetry.Exporter.Console
dotnet add package OpenTelemetry.Instrumentation.AspNetCore
The OpenTelemetry.Extensions.Hosting package includes the extension methods AddOpenTelemetryTracing and AddOpenTelemetryMetrics which is used on IServiceCollection to setup OpenTelemetry. It also adds the LoggingBuilder extension method AddOpenTelemetry. The OpenTelemetry.Exporter.Console nuget package which helps to output telemetry data on to the console. And the OpenTelemetry.Instrumentation.AspNetCore package collects telemetry data about incoming web requests.
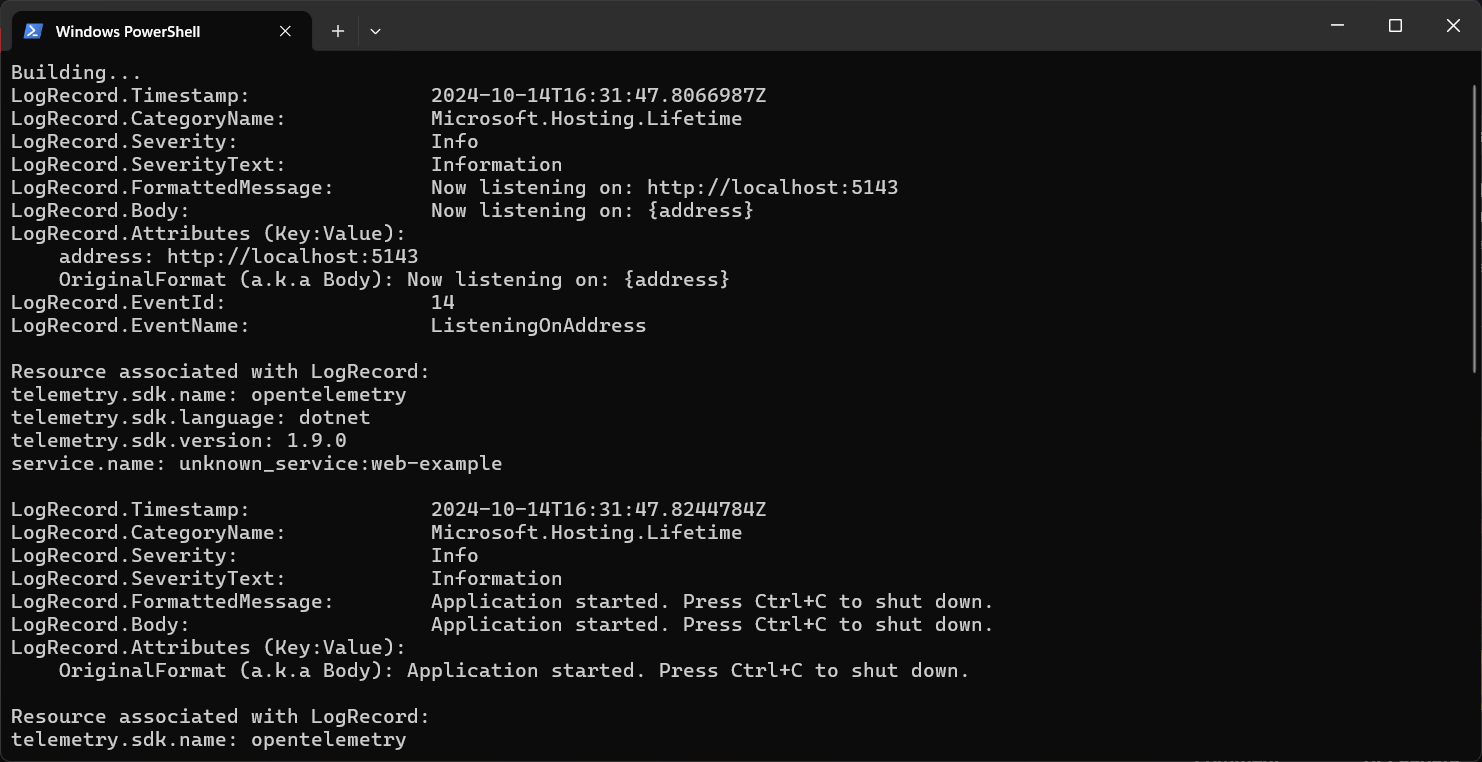
We will first configure logging. We can do this using the following code.
var builder = WebApplication.CreateBuilder(args);

const string serviceName = "web-example";

builder.Logging.ClearProviders()
    .AddOpenTelemetry(options =>
    {
        options.IncludeFormattedMessage = true;
        options.IncludeScopes = true;
        options.SetResourceBuilder(ResourceBuilder.CreateDefault().AddService(serviceName))
            .AddConsoleExporter();
    });
Here is the output.
Next we will be configuring tracing and metrics. We can do this using following code.
var builder = WebApplication.CreateBuilder(args);
const string serviceName = "web-example";
builder.Services.AddOpenTelemetry()
.ConfigureResource(resource => resource.AddService(serviceName))
.WithTracing(tracing => tracing
.AddAspNetCoreInstrumentation()
.AddConsoleExporter())
.WithMetrics(metrics => metrics
.AddAspNetCoreInstrumentation()
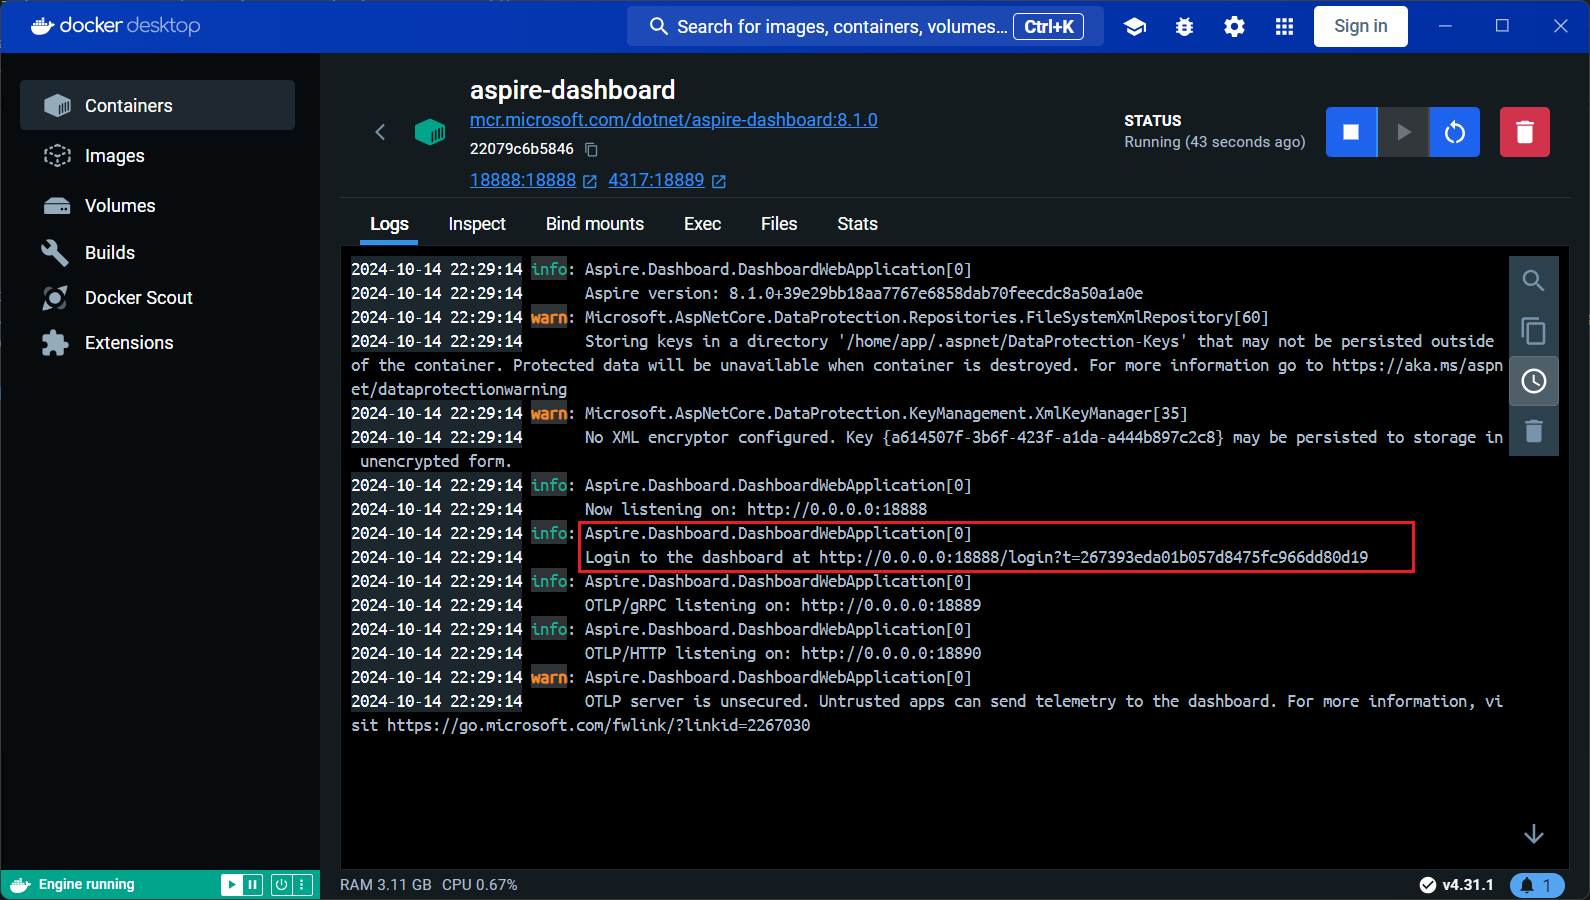
.AddConsoleExporter());Next we will be adding and configuring OtlpExporter and collecting and displaying data in the Aspire Dashboard. To use Aspire Dashboard we need to run Aspire Dashboard standalone using the following docker command - docker run --rm -it -p 18888:18888 -p 4317:18889 -d --name aspire-dashboard mcr.microsoft.com/dotnet/aspire-dashboard:8.1.0. Once the docker container is running, we can view the logs and open the URL with token parameter.
This command will expose localhost URL with port 4317 - which we need to configure in the application. To configure the OtlpExporter, we need first add the following nuget package - dotnet add package OpenTelemetry.Exporter.OpenTelemetryProtocol. Next we can modify the code like this.
const string serviceName = "web-example";
builder.Logging.ClearProviders()
.AddOpenTelemetry(options =>
{
options.IncludeFormattedMessage = true;
options.IncludeScopes = true;
options.SetResourceBuilder(ResourceBuilder.CreateDefault().AddService(serviceName))
.AddOtlpExporter(options=> options.Endpoint = new Uri("http://localhost:4317"))
.AddConsoleExporter();
});
builder.Services.AddOpenTelemetry()
.ConfigureResource(resource => resource.AddService(serviceName))
.WithTracing(tracing => tracing
.AddAspNetCoreInstrumentation()
.AddOtlpExporter(options=> options.Endpoint = new Uri("http://localhost:4317"))
.AddConsoleExporter())
.WithMetrics(metrics => metrics
.AddAspNetCoreInstrumentation()
.AddOtlpExporter(options=> options.Endpoint = new Uri("http://localhost:4317"))
.AddConsoleExporter());
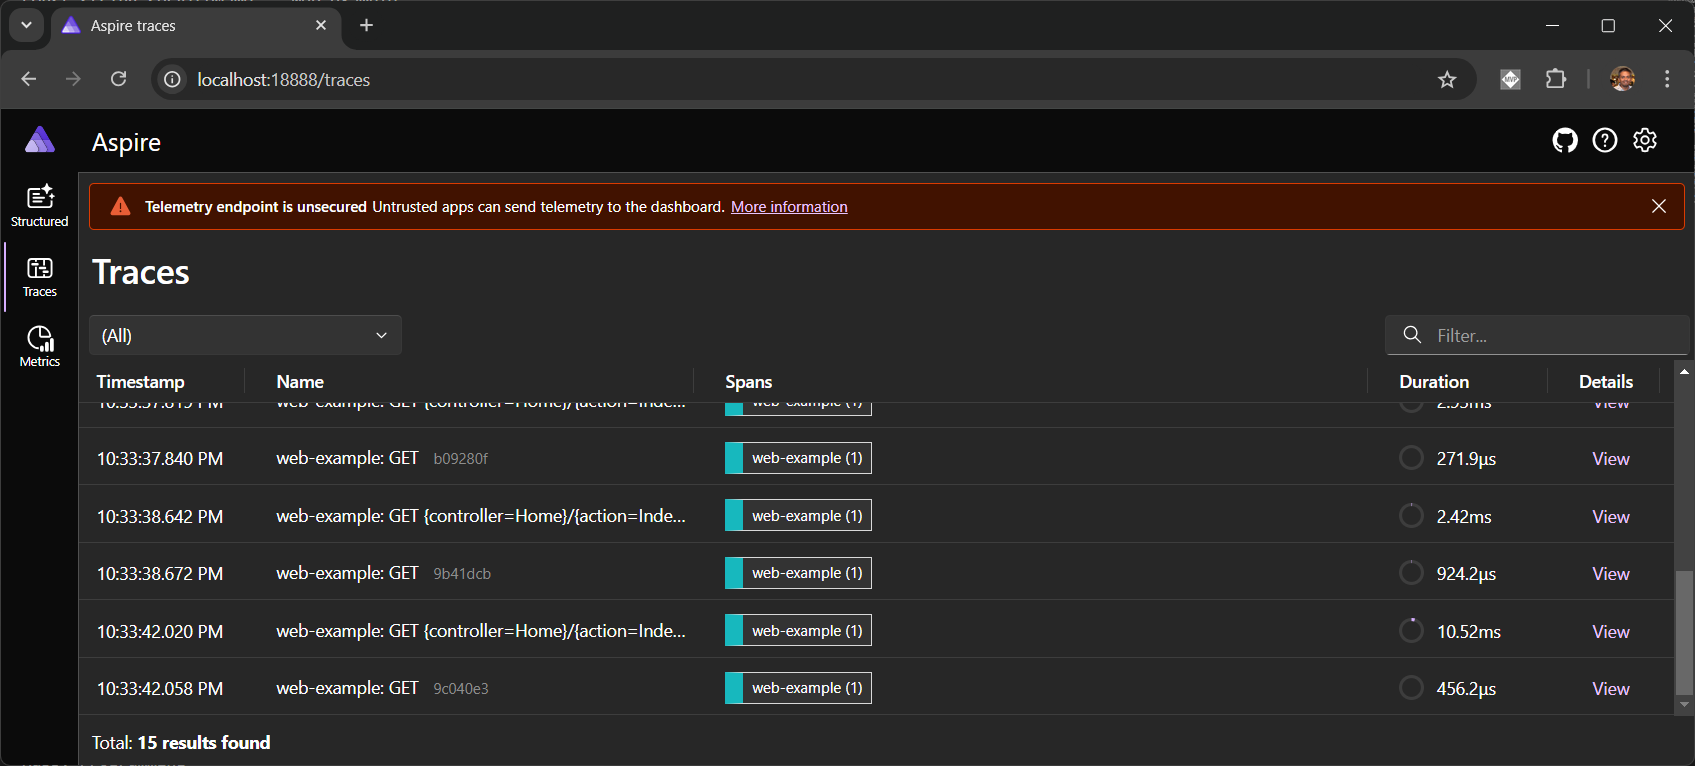
builder.Services.AddControllersWithViews();
var app = builder.Build();Once the application started running, we will be able to see the Aspire dashboard with logs, traces and metrics.
This way we can configure OpenTelemetry in ASP.NET Core applications, collect and visualize the data in Aspire Dashboard.
Happy Programming
If you find my content helpful, consider supporting my work. Your support helps me continue creating valuable resources for the community.

Found this useful? Share it with your network!
Copyright © 2026 Anuraj. Blog content licensed under the Creative Commons CC BY 2.5 | Unless otherwise stated or granted, code samples licensed under the MIT license. This is a personal blog. The opinions expressed here represent my own and not those of my employer. Powered by Jekyll. Hosted with ❤ by GitHub