Continuously audit web app performance using Google lighthouse and Azure DevOps
January 05, 2020 by Anuraj
lighthouse azure devops
This post is about how audit web applications using Google lighthouse and Azure DevOps. Lighthouse is an open-source, automated tool for improving the quality of web pages. Lighthouse can audit for performance, accessibility, progressive web apps, SEO and more. There is a LightHouse extension available in Azure DevOps. But in this post I am not using any marketplace extensions. Instead I am using some node and powershell scripts.
First we will configure and execute lighthouse audit locally. You can install lighthouse CLI using npm install -g lighthouse command. Once lighthouse installed, you can run the following command to run the audit - lighthouse https://dotnetthoughts.net/ --quiet --chrome-flags="--headless" This command will run the audit and create an HTML output file.
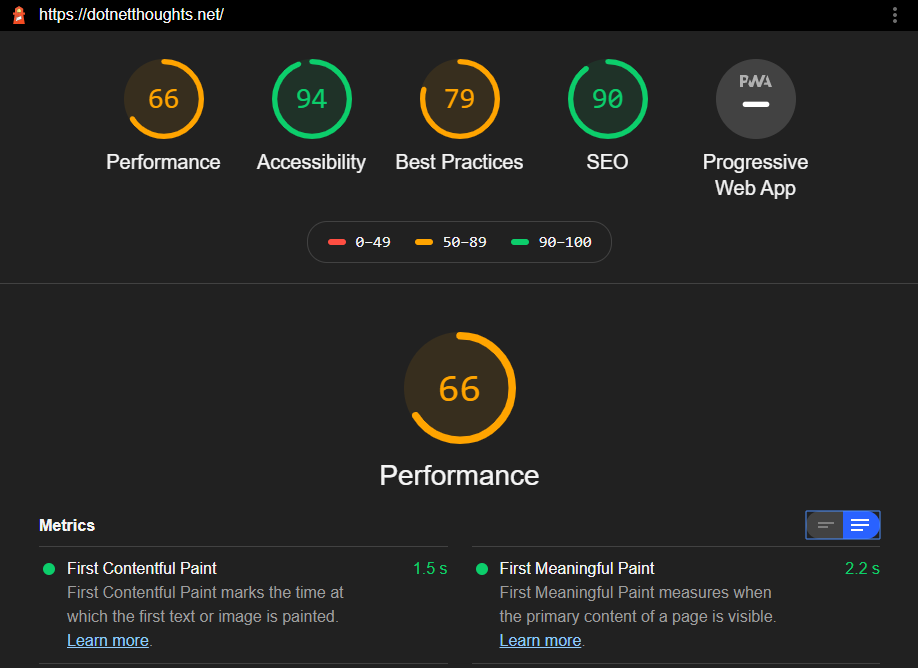
You can create an Azure DevOps project and in the build pipeline you can download and execute lighthouse using the above command. And configure artifacts upload build step to share the report with stakeholders. This feature is quite useful for sharing reports with stakeholders.
So here is my Azure DevOps pipeline for monitoring webapp using lighthouse.
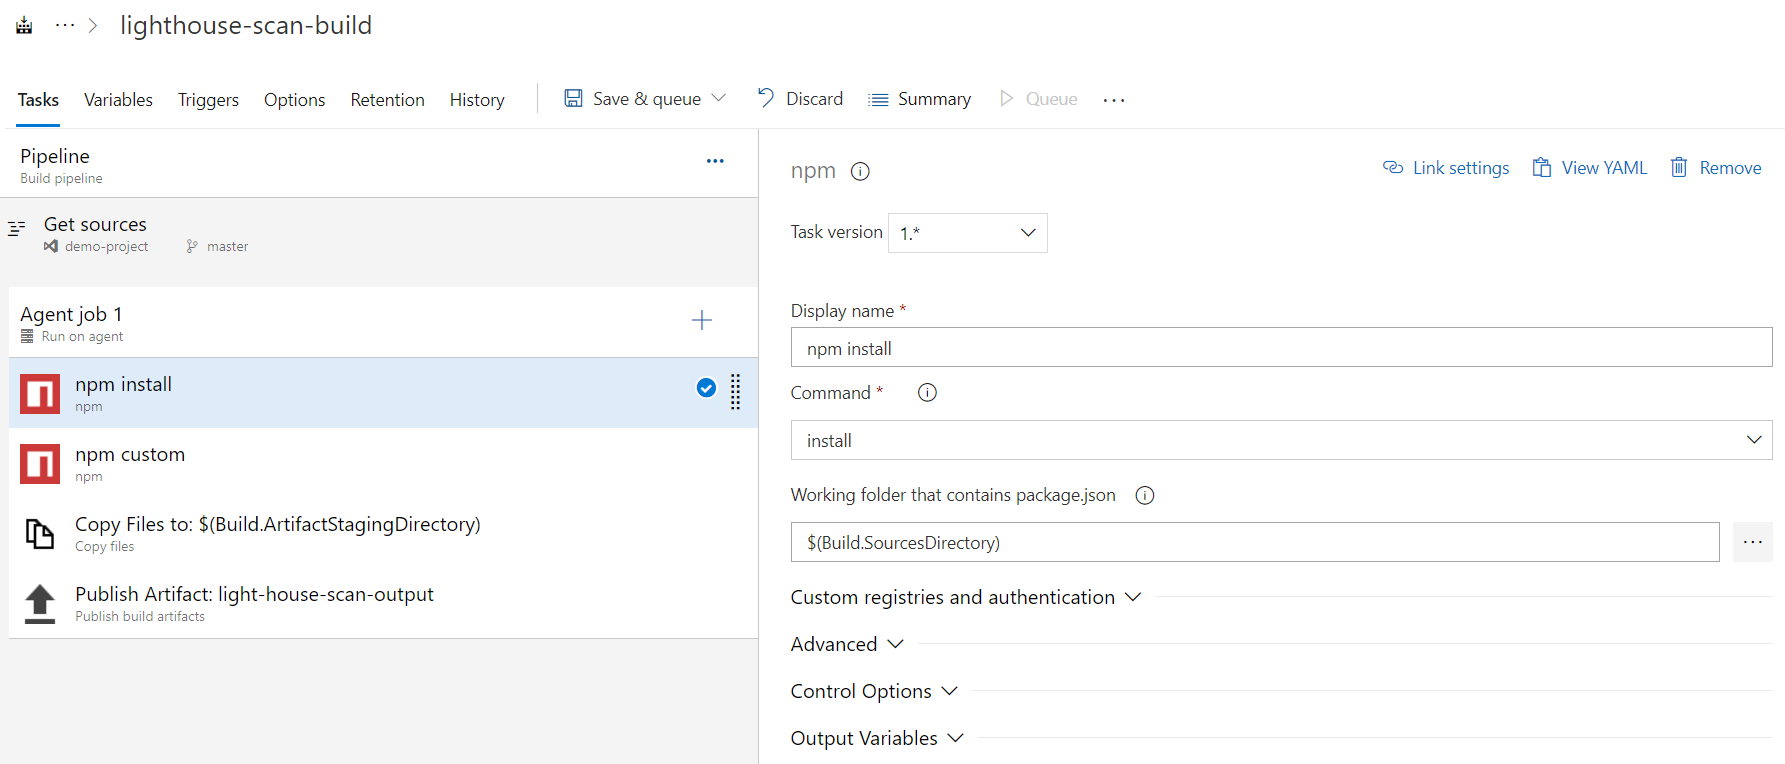
And for making the easy management, instead of installing the lighthouse directly I have created a package.json file, like the following.
{
  "name": "light-house-demo",
  "version": "1.0.0",
  "description": "azure build step for lighthouse scan",
  "main": "index.js",
  "dependencies": {
    "lighthouse": "^5.6.0"
  },
  "devDependencies": {},
  "scripts": {
    "scan-dotnetthoughts": "lighthouse https://dotnetthoughts.net/ --quiet --chrome-flags=\"--headless\"
  },
  "author": "anuraj",
  "license": "MIT"
}
So in the build pipeline, first I will run npm install and in the next build step I am executing scan-dotnetthoughts node script command, which will execute the command and save the html file in the directory. Next build step will copy the HTML file to the artifacts directory and developers can download it from the artifacts.
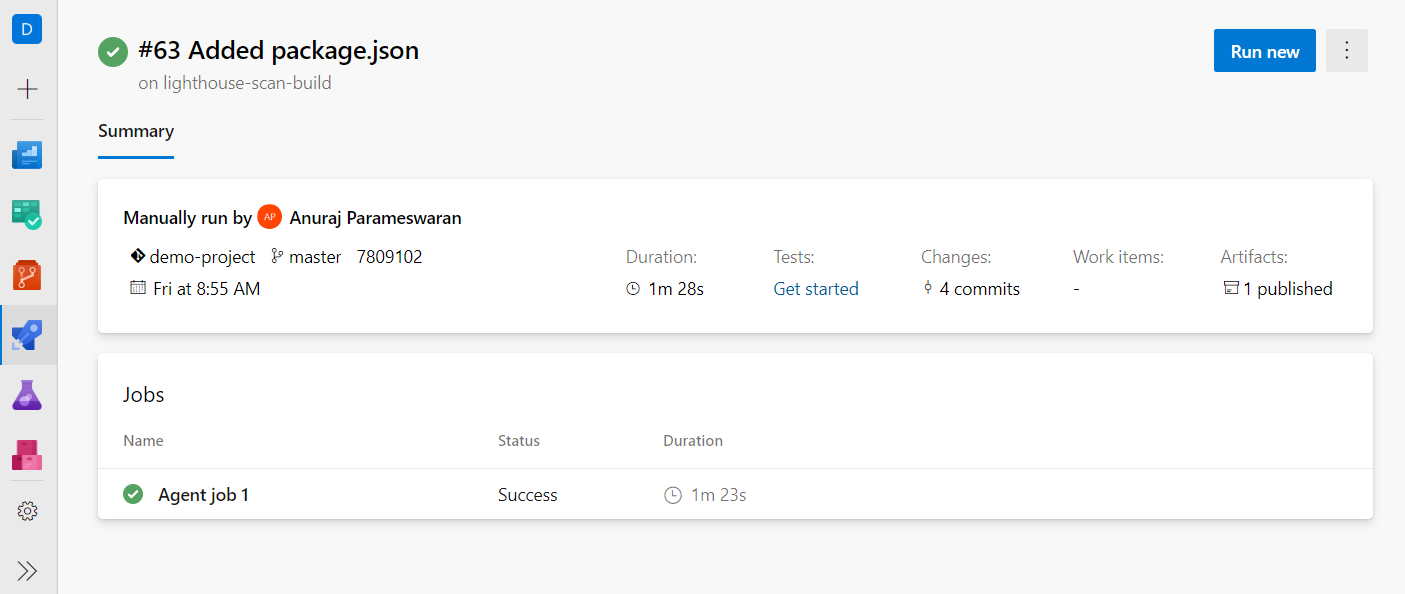
As I mentioned earlier this report is good if you’re sharing the report to clients or stakeholders - but as a developer I am more interested to see the results more insightful way - like tests. So that I can compare how many new issues are coming, and how we are improved all those details. To do that I am adding few more build steps - which will convert the output from lighthouse (there is an option to generate JSON output along with HTML) as JUnit results xml file.
So I am modifying the script command like this - "lighthouse https://dotnetthoughts.net/ --quiet --chrome-flags=\"--headless\" --output json --output html --output-path ./dotnetthoughts"
Next I am adding a powershell script with Inline text - this powershell script will parse the JSON and convert it to XML which is compatible with JUnit text results. And we copy the JUnit XML files and publish it as Test results using the Publish Test Results build step. Here is the updated build pipeline.
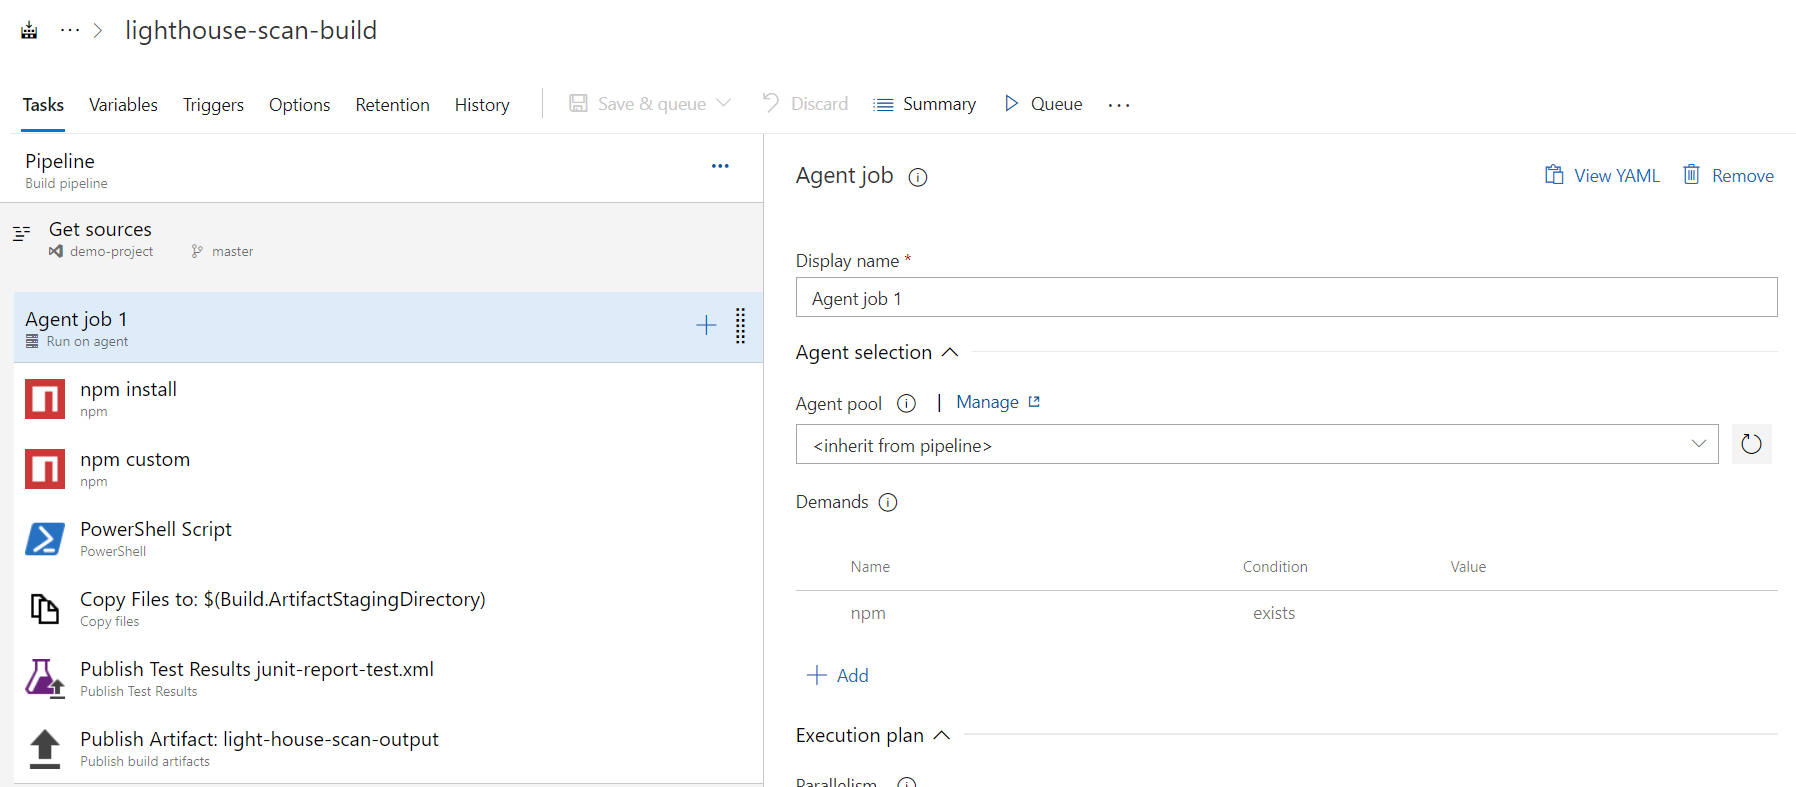
And here is the powershell script, which convert the JSON to JUnit XML.
For the powershell expert users - I am a powershell beginner, if you found any issues with the implementation please let me know.
And here is the Test results.
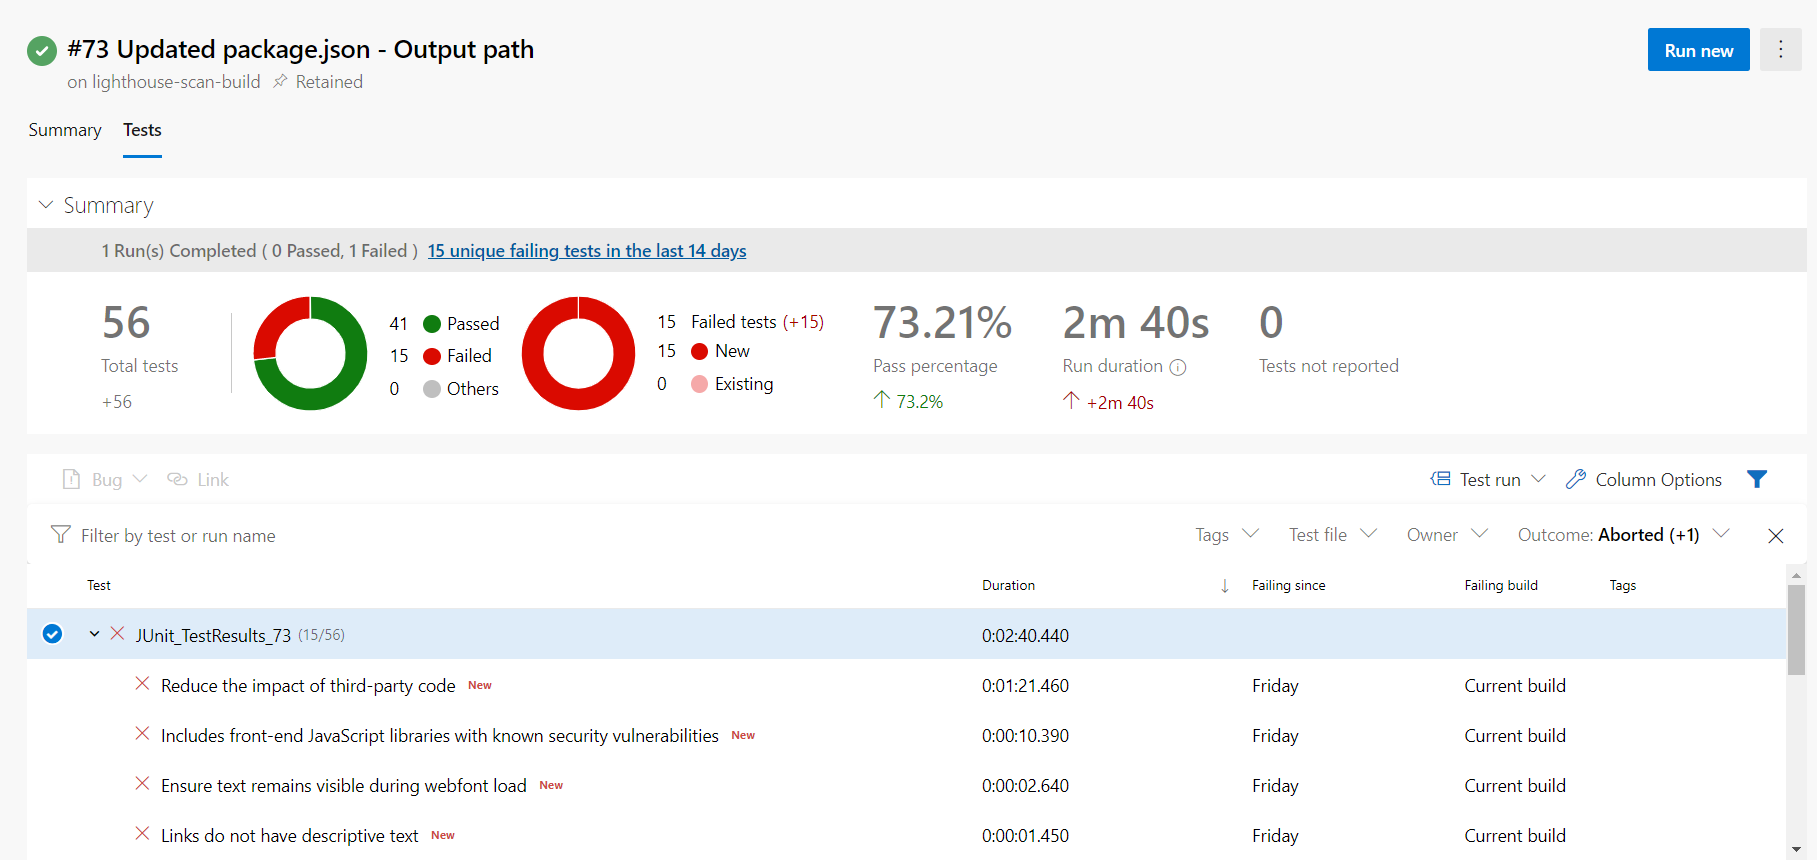
And here is the full YAML code for the build pipeline - https://gist.github.com/anuraj/89c9275cb180d53c1f2d899219d7ed0f
In this post we learned about how to scan web app using Google Lighthouse, integrate it to Azure DevOps pipeline. Also we learned about how to convert the lighthouse JSON to JUnit XML using powershell. The lighthouse extension from Azure DevOps marketplace allows you to stop build based on conditions.
Happy Programming :)
Found this useful? Share it with your network!
Copyright © 2026 Anuraj. Blog content licensed under the Creative Commons CC BY 2.5 | Unless otherwise stated or granted, code samples licensed under the MIT license. This is a personal blog. The opinions expressed here represent my own and not those of my employer. Powered by Jekyll. Hosted with ❤ by GitHub
